Redlining Louisville: The History of Race, Class, and Real Estate
Louisville Metro Government’s Office of Redevelopment Strategies is launching a citywide effort to address the issue of redlining in Louisville – past and present.
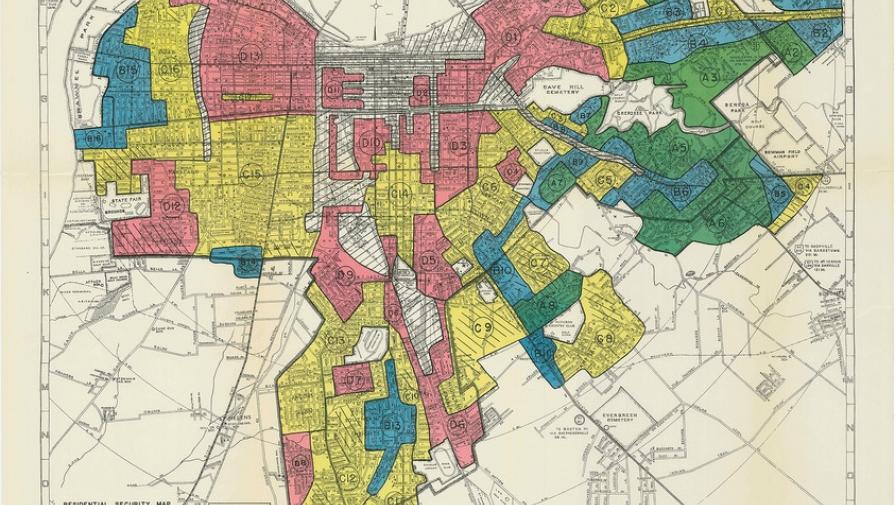
This effort is the result of an independent research project by urban planner Joshua Poe. Poe developed and created the interactive story map entitled “Redlining Louisville: The History of Race, Class and Real Estate" to illustrate how redlining impacted Louisville in the past, and still does today. The map will be used to enhance community conversations about redlining, which takes many forms but is most commonly the practice of denying loans in certain neighborhoods because of race or socioeconomic characteristics. After locating Louisville's redlining maps after years of searching, the Office of Redevelopment Strategies agreed to fund Poe's work.
Redlining dates back to 1933, when the U.S. government created the Home Owner’s Loan Corporation (HOLC) to bolster the housing market and homeownership opportunities across the nation. The HOLC created residential securities maps, better known as redlining maps, to guide investment in U.S. cities. These maps assigned grades to neighborhoods to indicate their desirability for investment. Black, immigrant and low-income neighborhoods were often given low grades, eliminating their access to mortgage insurance or credit for decades. Although the HOLC was discontinued in 1951, the impact of disinvestment resulting from redlining is still evident in Louisville and most other U.S. cities today.
“Our city defines compassion as providing citizens the tools and support necessary to reach their full human potential,” Mayor Greg Fischer said. “Through past and present forms of redlining, unnecessary hurdles are placed in front of some residents, keeping them from that potential. This map and data is meant to spark a community conversation that results in removing those hurdles.”
This story map illustrates the ways that redlining has affected housing development, disinvestment and lending patterns in Louisville since the 1930s. By layering data sets such as vacant properties, building permits and property values, the map shows how the intentional redlining that was devised in the 1930s has had consequences that are evident still today.
Examples of conventional redlining that still exists today include refusal to provide delivery in certain areas, business loan denials regardless of credit-worthiness and refusal to write property insurance policies or dropping property owners from insurance coverage altogether.
Other forms of redlining, referred to as reverse redlining, also exist. Examples of reverse redlining include offering services low-income residents at higher prices, higher interest rates and excessive service fees or inferior products. This example may come in forms such as payday loans, cash advances, and expedited tax returns.
With the launch of the interactive map, the city is convening a yearlong community dialogue to gain understanding, to collect ideas and to formulate recommendations that support citizens’ wealth-creation, homeownership and development opportunities in west Louisville and other areas experiencing disinvestment. By beginning this dialogue, the city is acknowledging the past and working to better our future by removing hurdles that prevent some residents from reaching their full human potential.
“Today is an opportunity to begin talking openly about many of the systematic and institutional challenges faced by everyday people trying to get ahead,” Office of Redevelopment Strategies Director Jeana Dunlap said. “Some of our neighborhoods need basic services or amenities that may be taken for granted in other areas of town. We hope to bring light to these challenges and find innovative ways to stimulate investment, stabilize housing conditions and improve overall quality of place for impacted areas.”