Using Story Maps in the 2017 Health Equity Report
The 2017 Health Equity Report is designed as a tool for policy makers and residents to better understand how they can create more equitable policies and practices, and it examines the history of Louisville and how our past has influenced our present. The report shows the demographics and diversity of the city’s residents, noting, for example that Louisville’s population is growing and becoming more diverse. It reviews 21 health outcomes such as infant mortality, homicide and heart disease, and examines 11 root causes for those outcomes, ranging from food systems to neighborhood development. These health outcomes are arranged in the order of the life course, from infancy through old age, to demonstrate how root causes have different impacts at every life stage and can have cumulative effects over time.
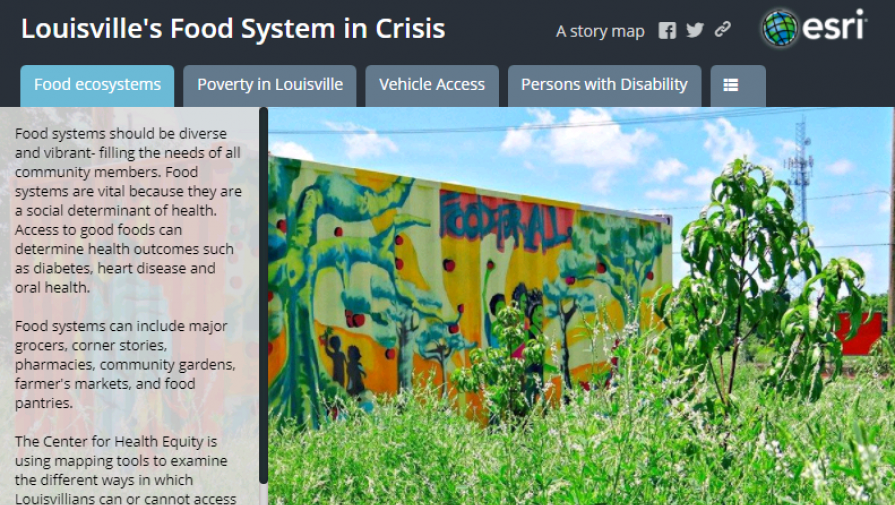
The report also is using Esri's Story Maps using LOJIC data to show root causes of our health in a new and exciting way. The first story map is about "Louisville's Food System in Crisis". This is the first of many story maps to come. These maps will explore the data behind root causes in Louisville in more detail than is found in the full report. Stay tuned for ongoing updates and publications.
The first story map examines Louisville's food system. Click through the different tabs to learn about different ways this root cause is linked to other root causes and health outcomes. Click on the maps to see detailed statistics and information about food resources such as farmer's markets and grocery stores, as well as data on race and ethnicity, transportation, and life expectancy. Have fun exploring and feel free to contact the Center for Health Equity with questions.
Take a brief survey and download the full report here: 2017 Health Equity Report (size 79MB).